
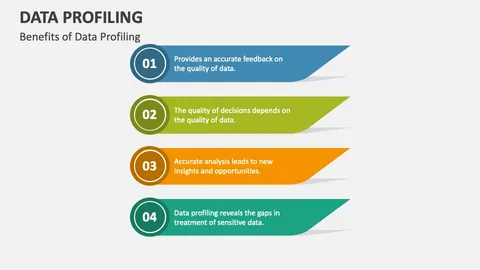
Data fuels decisions across retail, finance, healthcare, logistics, and public services in Hyderabad. Yet raw records are messy: fields drift, formats vary, and values arrive late or not at all. Data profiling provides the discipline to measure quality, reveal issues, and prioritise fixes before results reach dashboards or models.
Good profiling is more than a one-off audit. It is a continuous practice that couples automated checks with clear ownership, so teams learn where data falls short and how to improve it. With the right tools and routines, quality rises while firefighting declines.
Why Data Profiling Matters in Hyderabad
Local organisations often blend legacy systems with modern cloud platforms, and each adds quirks. Seasonal peaks during festivals, unexpected disruptions such as heavy rains, and diverse supplier feeds increase variance in timeliness and completeness. Profiling makes these realities visible, helping teams set realistic service levels and avoid brittle assumptions.
When stakeholders trust the numbers, they act faster. Profiling builds that trust by surfacing quality metrics alongside business metrics, so users can judge whether today’s data is ready for decisions.
What Data Profiling Covers
Profiling inspects the shape and behaviour of data. Core tasks include schema verification, type inference, pattern checks, uniqueness analysis, referential integrity, and distribution profiling for numeric and categorical fields. Together, they form a picture of whether a dataset is fit for purpose.
Results should lead to action, not just reports. Findings feed backlog items, data contracts, and targeted fixes in source systems, closing the loop between measurement and improvement.
Key Data Quality Dimensions
Accuracy tests whether values reflect reality, using rules or authoritative references. Completeness tracks required fields and acceptable null rates, while consistency checks conflicts across systems and time. Timeliness measures lateness relative to promised delivery, and validity ensures values conform to formats and ranges.
Uniqueness prevents duplicate entities and accidental double-counting. These dimensions give teams a shared language for quality discussions, avoiding vague debates about “bad data.”
Tools: From Lightweight to Enterprise-Grade
Python libraries can generate fast, exploratory profiles directly from sample tables. Warehouse-native frameworks add declarative tests for schemas, ranges, freshness, and uniqueness, enabling teams to “fail fast” when guarantees are broken. Browser-based tools assist analysts in profiling spreadsheets and CSVs before ingestion.
At scale, observability platforms track metrics like freshness, null rates, and distribution drift across pipelines. Whatever the stack, choose tools that store results, support versioned rules, and integrate with orchestration and alerting.
Techniques for Reliable Profiling
Start with column summaries: min, max, mean, standard deviation, and percentiles for numerics; cardinality, top-k values, and entropy for categoricals. Add pattern checks with regular expressions for codes, dates, and identifiers, and validate cross-field dependencies such as start date before end date.
Profile joins and referential integrity between fact and dimension tables. Small sample checks catch obvious issues quickly, while periodic full scans confirm that rare but important errors are not slipping through.
Skills and Learning Pathways
Analysts and engineers need fluency in profiling concepts, SQL for summarisation, and light scripting for automation. They should be able to interpret histograms, quantiles, and drift statistics, and translate findings into rules that a pipeline can enforce. Communication skills matter too; quality work succeeds when it is understood by finance, operations, and product alike.
For structured, practice-led upskilling that blends fundamentals with exercises and peer review, a Data Analyst Course can speed the journey from ad-hoc checks to reproducible, trustworthy profiling embedded in production.
Use Cases Across the City
Retailers compare price and stock feeds to spot anomalies before customer impact. Logistics teams assess GPS traces and booking data for gaps that would derail routing or capacity planning. Hospitals track admission feeds and discharge records to ensure clinical dashboards reflect the last 24 hours accurately.
Civic projects profile ward-level datasets—sanitation, water, or traffic—to prioritise clean-up before public releases. In each case, profiling reduces uncertainty and sharpens decisions.
Choosing the Right Metrics
Do not measure everything; measure what drives decisions. If a forecast depends on lead time, prioritise timeliness and outlier bounds. If compliance depends on unique identifiers, emphasise uniqueness and referential integrity.
Define thresholds that reflect risk. A 1% null rate may be fine for optional fields but unacceptable for legal identifiers. Align metrics with impact rather than aesthetics.
Local Ecosystem and Hiring
Hyderabad’s employers value portfolios that show disciplined profiling and clear communication. Repositories with tidy tests, readable rules, and dashboards that pair quality with business metrics stand out more than tool lists. For place-based mentoring and projects aligned to local sectors, a Data Analytics Course in Hyderabad can connect students to retail, utilities, logistics, and civic datasets.
Local familiarity helps. Knowing festival seasonality, regional supply chain challenges, and typical vendor constraints turns generic rules into sharp, context-aware checks.
Scaling and Cost Management
Start with a handful of high-value tables and expand coverage gradually. Consolidate rules into shared libraries, retire orphaned checks, and review alert volume monthly. Cost visibility—compute, storage, and human time—keeps programmes sustainable.
When teams see the price of noisy checks, they write better ones. A lean, well-targeted rule set beats sprawling, seldom-read reports.
Common Pitfalls and How to Avoid Them
Beware of over-reliance on single snapshots; quality often fluctuates. Avoid vague rules like “few nulls” and prefer explicit bounds and dates. Do not let profiling diverge from evolving business definitions; keep rules, contracts, and metrics in sync.
Another trap is burying results in private dashboards. Bring visibility to where decisions happen, and ensure ownership is clear when a rule fails.
Implementation Roadmap
Phase 1 profiles define scope, owners, and a minimum rule set for each critical table. Phase 2 automates checks in the pipeline, adds alerting, and publishes quality dashboards. Phase 3 extends coverage to cross-system integrity, de-duplication, and drift.
Each phase ends with a short retrospective and an agreed list of rules to tighten, retire, or add. This rhythm prevents backlog bloat and keeps the system focused on value.
Sustaining Capability
Communities of practice, brown-bag talks, and rotating stewardship keep quality a shared responsibility. Templates for new tables, change logs for rules, and incident reviews that prioritise learning over blame form the cultural backbone of durable programmes.
As proficiency grows, teams can mentor peers and consolidate know-how into playbooks that speed onboarding without sacrificing rigour. A follow-on Data Analyst Course can reinforce these habits and help practitioners step into leadership roles with confidence.
Conclusion
Data profiling translates messy reality into measurable quality, turning “we think the data is fine” into “we know the data is ready for this decision.” By choosing meaningful metrics, enforcing clear contracts, and embedding checks into pipelines, Hyderabad’s teams can raise trust while reducing surprises. For practitioners seeking structured, locally relevant practice that links profiling with delivery, a Data Analytics Course in Hyderabad offers a practical bridge from aspiration to dependable execution.
ExcelR – Data Science, Data Analytics and Business Analyst Course Training in Hyderabad
Address: Cyber Towers, PHASE-2, 5th Floor, Quadrant-2, HITEC City, Hyderabad, Telangana 500081
Phone: 096321 56744